Docs · Updated November 2026
What's new in 0.2: the Job Monitor
FabriBuddy started as a lineage tool: where every table in a Fabric tenant comes from, the exact lines of code that write it, and who can see every Power BI report. Version 0.2 adds the question that comes right after "where does this table come from?", which is "did the thing that writes it actually run last night?"
The Job Monitor shows every run of every pipeline, notebook, Dataflow Gen2, semantic model refresh, Spark job definition and copy job in your tenant, in one app, next to the lineage.
Try it in the live demo Download the deploy notebook
Every item and its last runs, then one pipeline: its details and its execution chain. Then every item's runs over the last 6 hours, the month, and the whole estate's dependencies.
Why another monitor
The Fabric Monitor hub is fine for "did this one item fail?". It gets hard when the answer depends on other items:
- A pipeline failed at 02:14, but which activity, and which notebook did that activity start?
- An orchestrator notebook ran ten notebooks with
runMultiple. Which one got slower? - A notebook succeeded, but its input table's writer had failed an hour earlier. Green, but wrong.
- Two items that depend on each other are on separate schedules and only line up by luck.
FabriBuddy already reads every pipeline definition and parses every notebook to build the lineage. So it knows which item starts which, and which item writes which table. The Job Monitor puts the run history on top of that.
Items
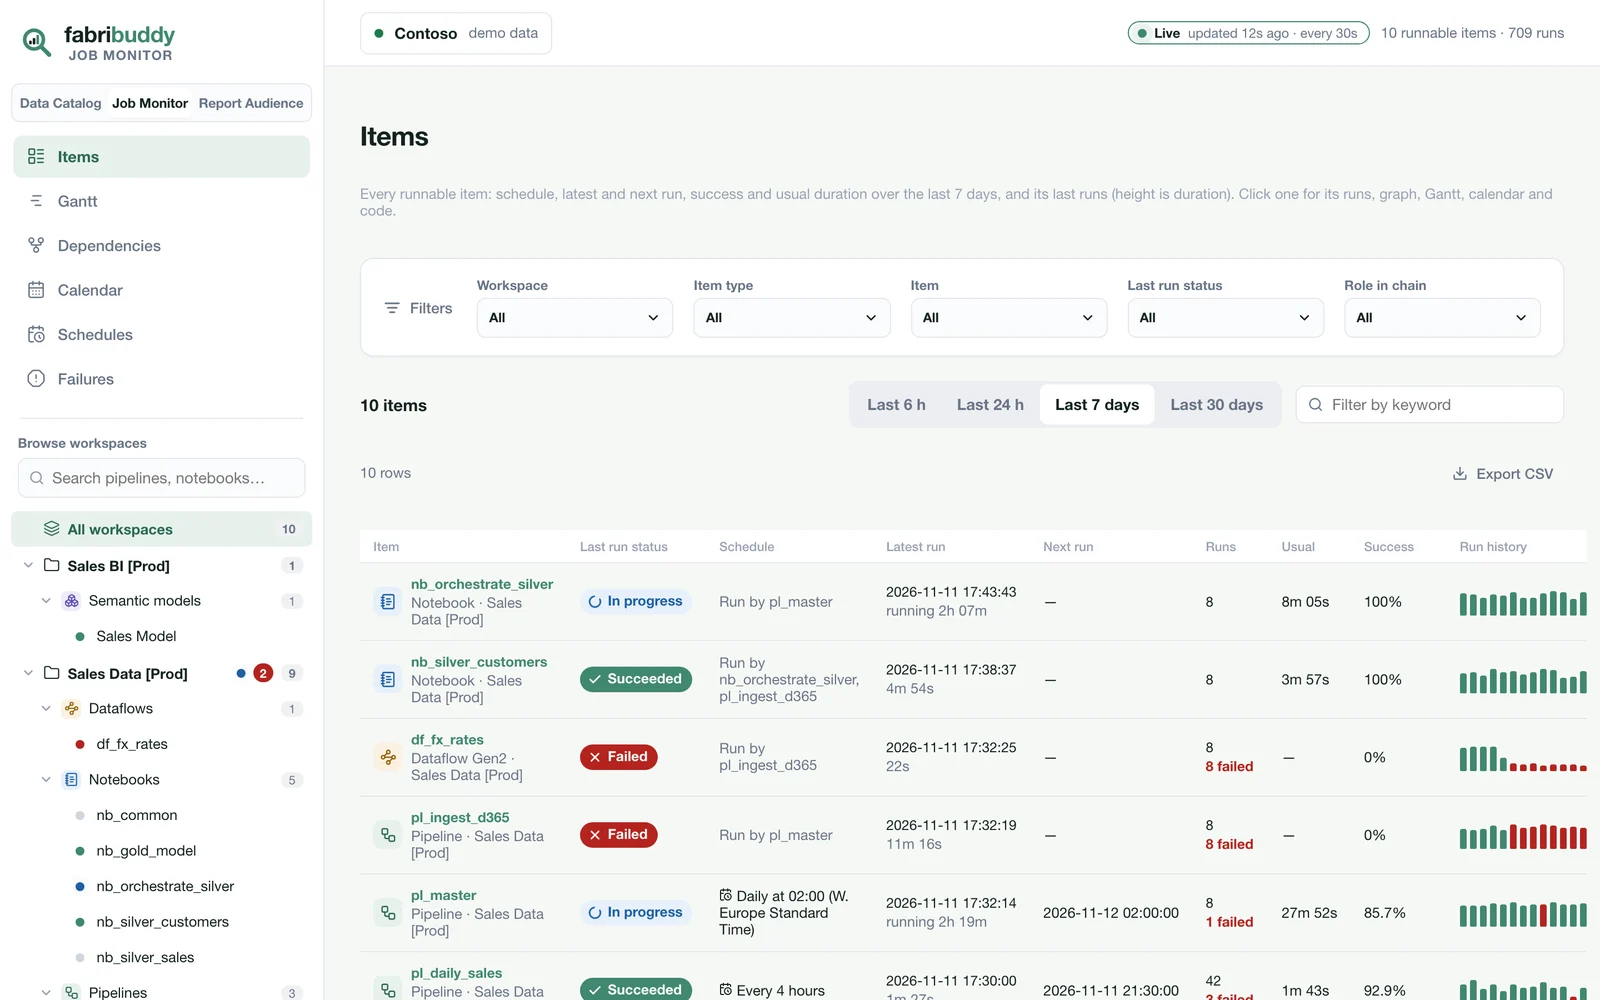
Every runnable item in one list: its schedule, or what runs it; its latest and next run; its runs and failures in the last 6 hours to 30 days; its usual duration and success rate; and its run history as bars, where the height is the duration and the colour is the status. Filter by workspace, item type, item, status, role in a chain or keyword, and the filters follow you to every page.
Dependencies: the whole estate on one graph
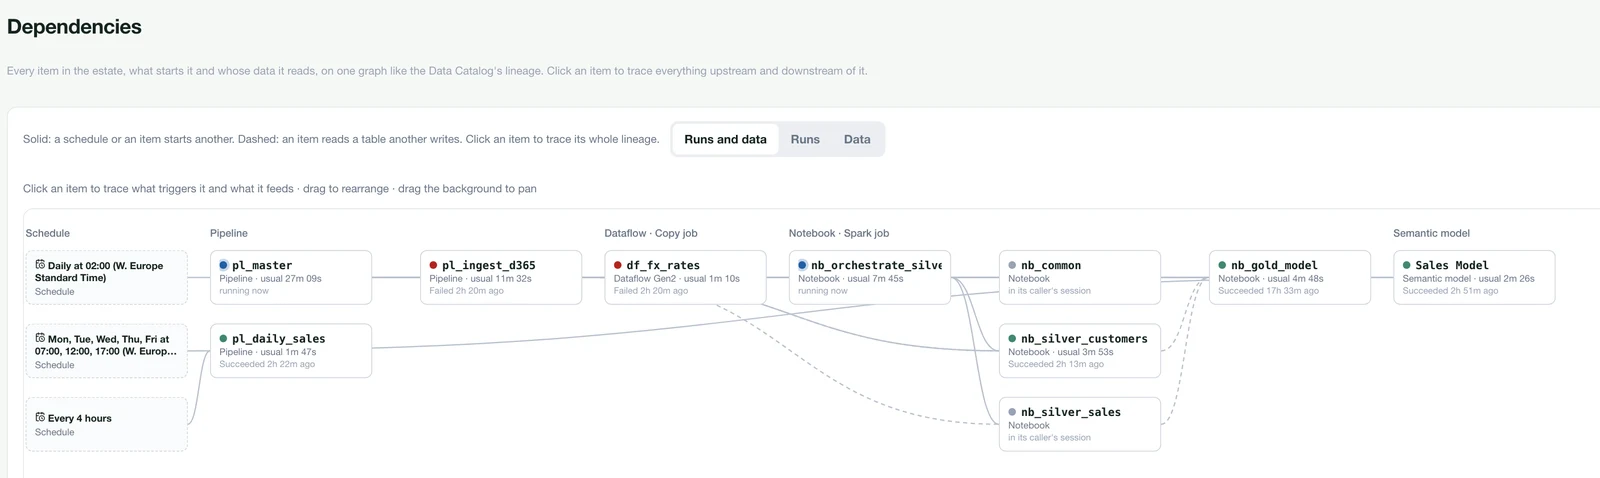
Every item in the tenant on one graph, like the Data Catalog's lineage: which schedule starts it,
which pipeline or orchestrator notebook runs it (including runMultiple, notebook.run and %run),
and whose tables it reads. Click an item to trace everything upstream and downstream of it.
Each item's page shows its own chain and a graph of each run: the pipeline's activities, the child pipelines they invoked, and the notebooks and refreshes those started, each with its status and duration.
Below the graph are the dependency checks:
- Ran on failed input: the reader ran after its input's writer failed.
- Started before its input was ready: the reader started while the writer was still running.
- Not ordered: nothing runs the two in order. They start on their own schedules.
- Started twice: an item has its own schedule and is also run by an orchestrator.
In the Contoso demo it finds that nb_gold_model ran ten times after df_fx_rates failed, and that
Sales Model is refreshed by its own schedule and by the pipeline.
Gantt, Calendar, Schedules, Failures
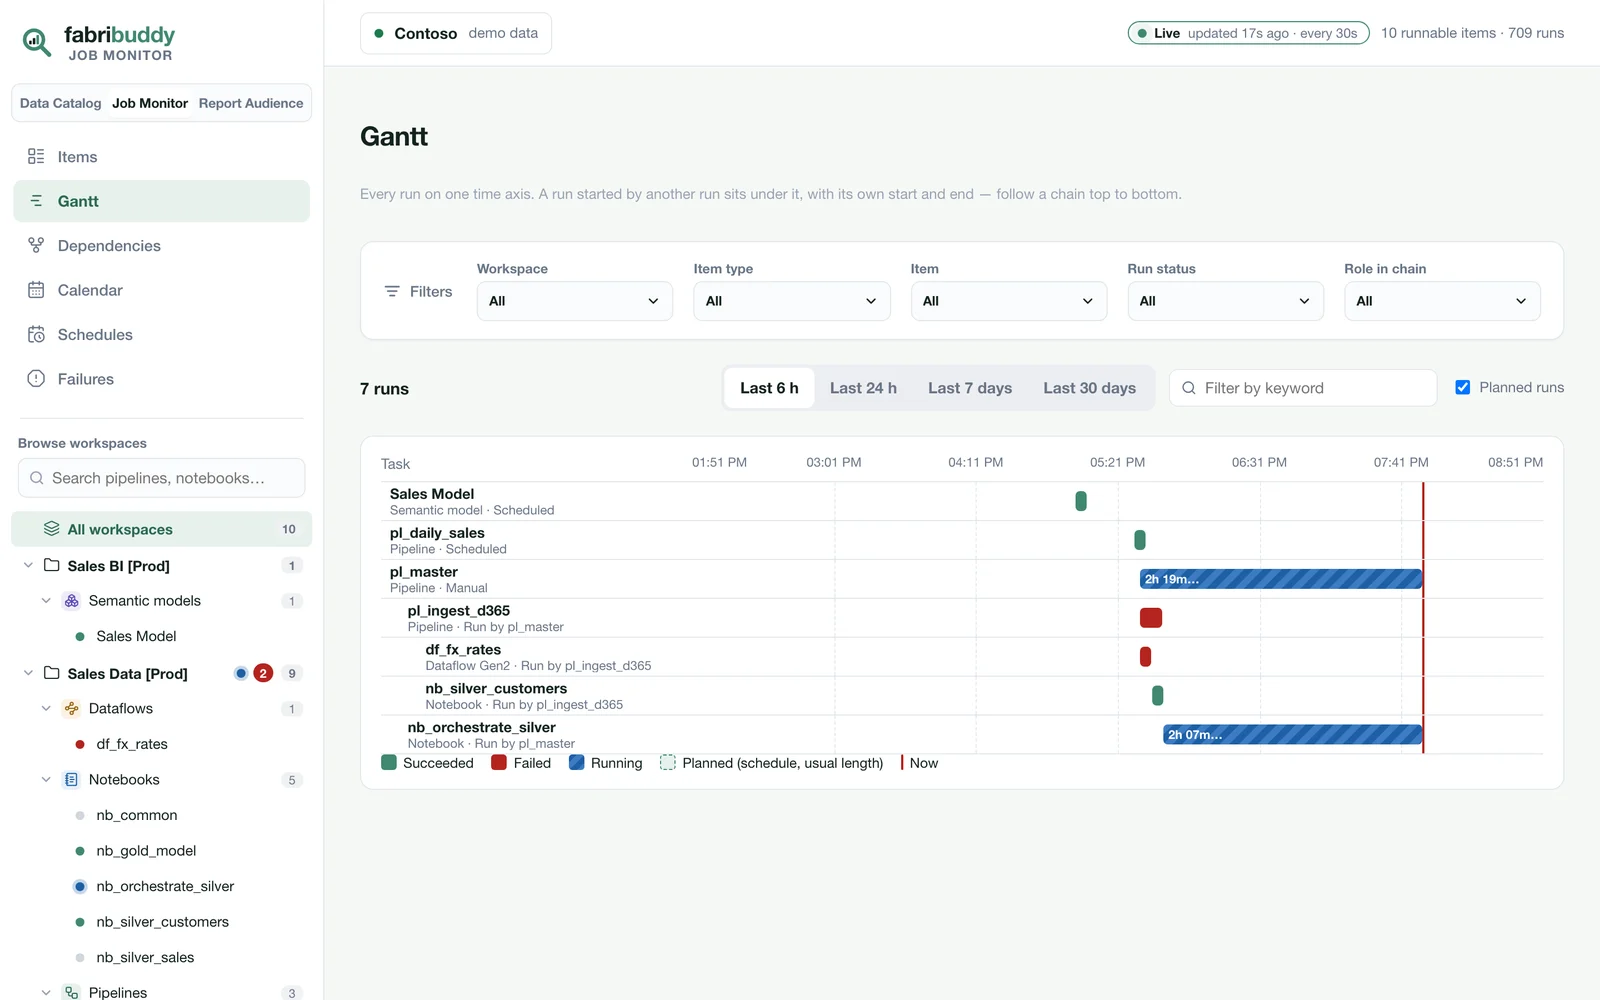
- Gantt: over 6 or 24 hours each run is a row and a run started by another sits under it. Over 7 or 30 days each item is one lane, so a nightly load creeping later stands out.
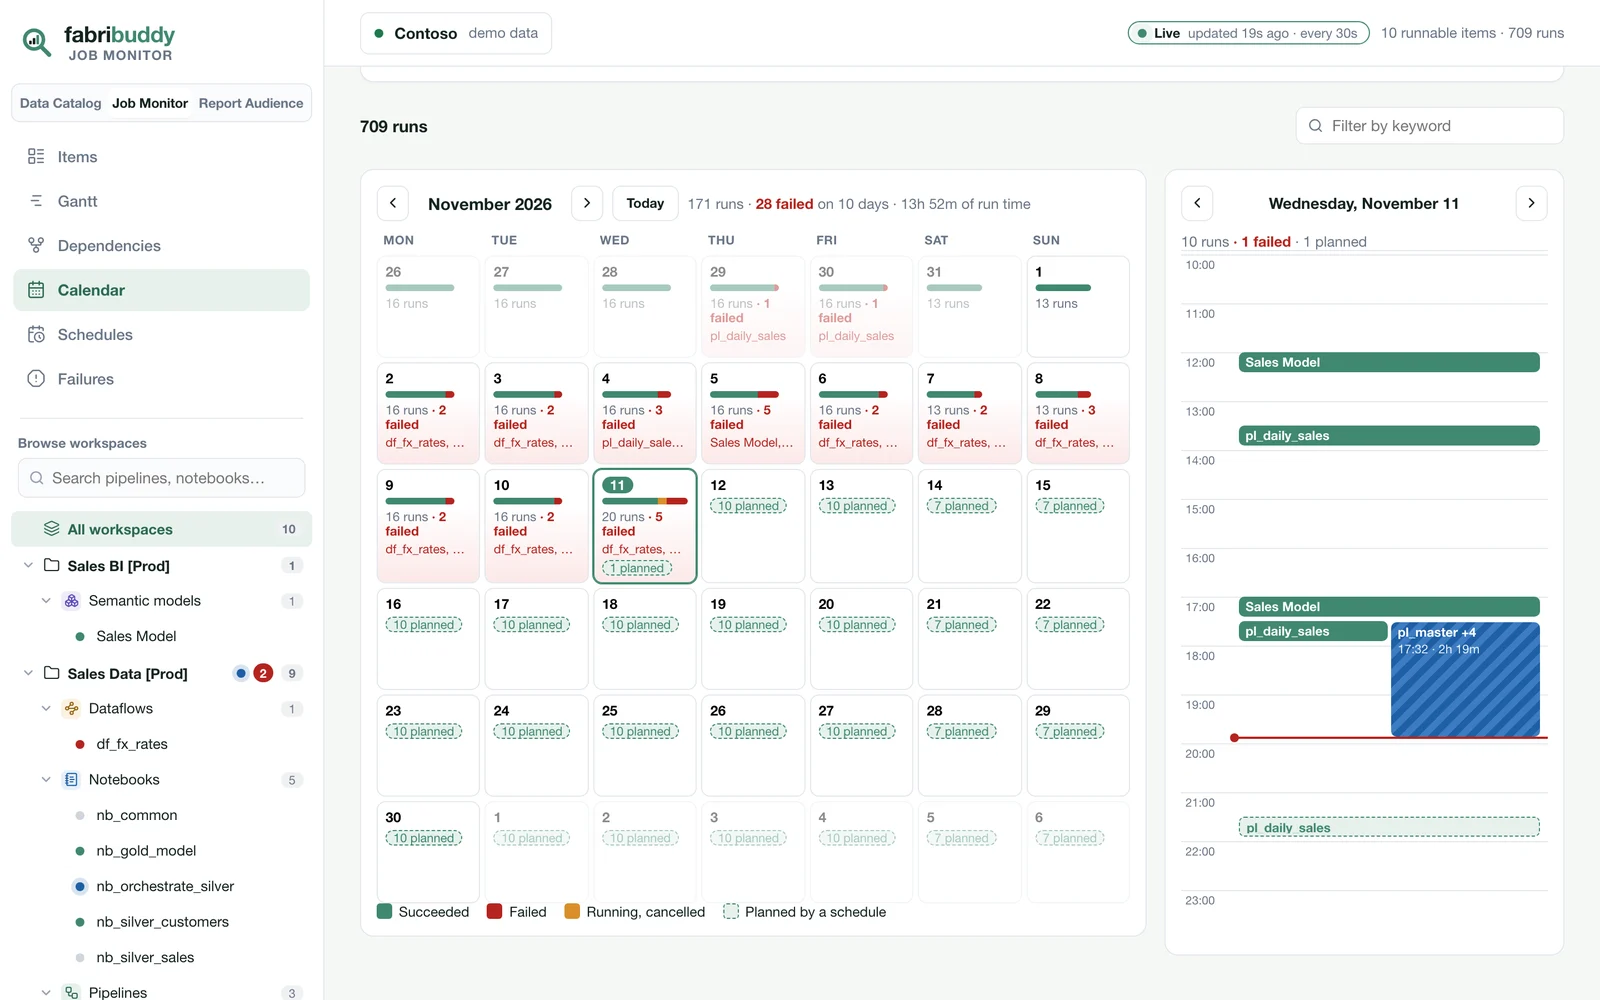
- Calendar: a month of runs with each day's outcome, its failed items and what the schedules will start, and the picked day hour by hour.
- Schedules: every schedule, its next runs and its last 5 runs.
- Failures: failed runs grouped by item and error, so ten nights of the same error is one row.
One item
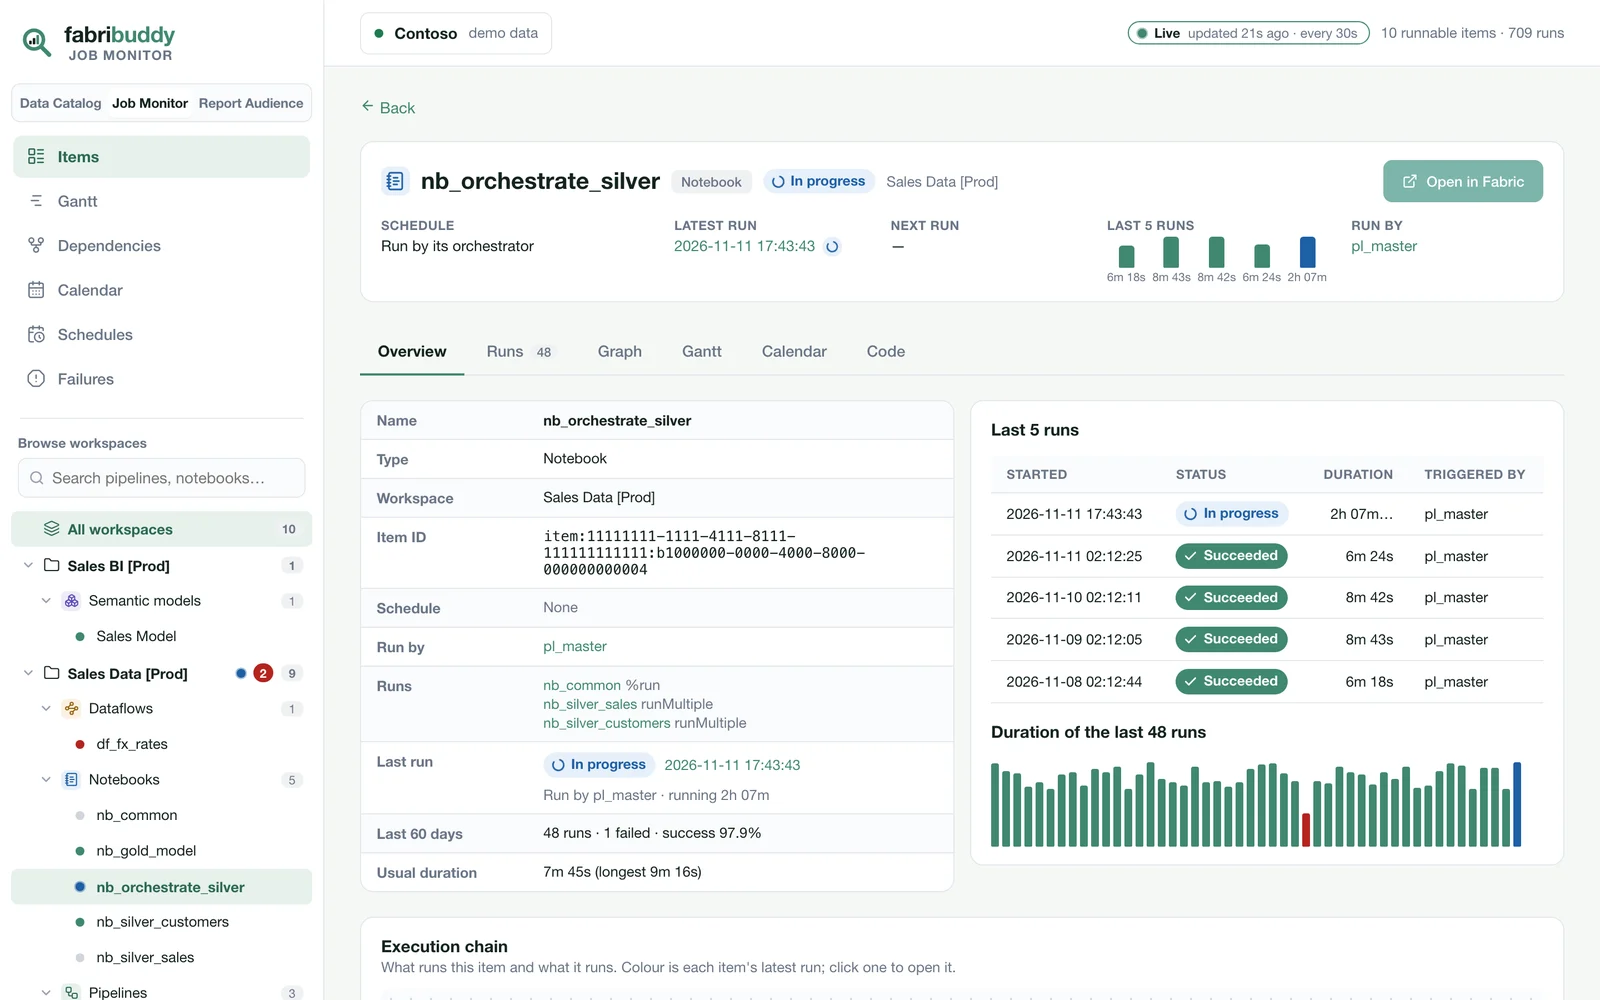
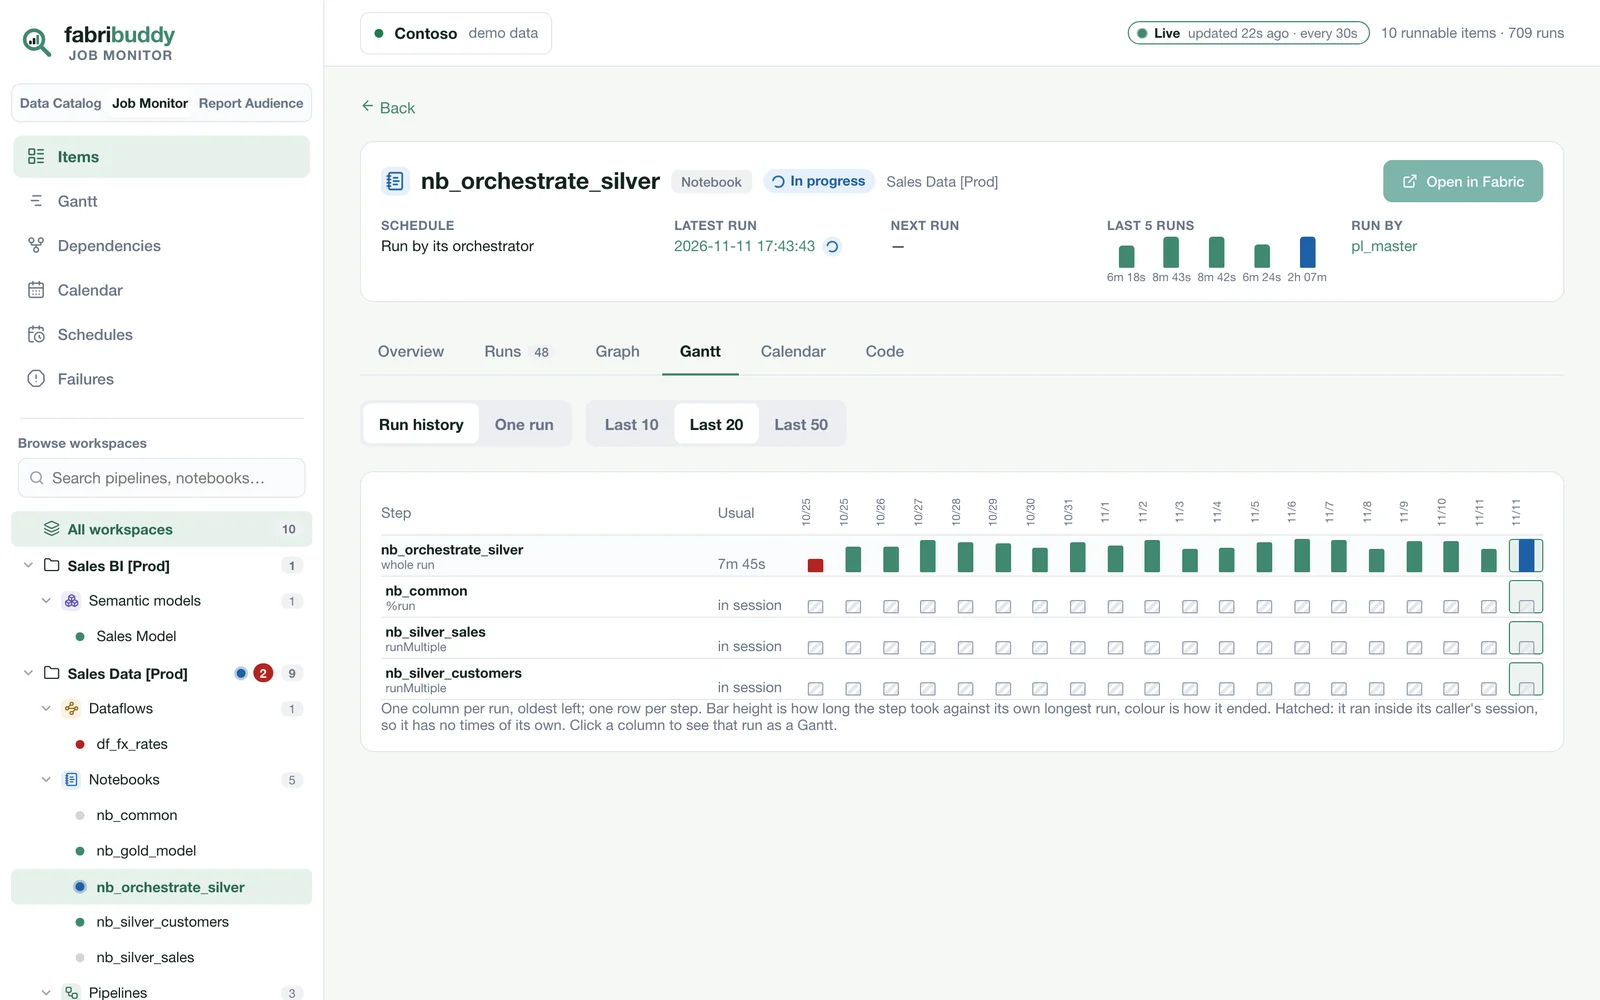
Open an item for its schedule, latest and next run, and last five runs at the top. Then the tabs: an overview with the tables it reads and writes, the runs, a graph of one run, a run history (one column per run, one row per step, to see which step got slower or started failing), a calendar with the item's busy hours, and the code.
Optional: live
By default the monitor is as fresh as the daily scan. Set LIVE_MONITOR = True when you deploy and
the FabriBuddy_Live notebook refreshes the monitor every minute, so a run that starts shows up in
the app within about a minute and a half. More on live.
Also in 0.2
- 0.2.1: Open in Fabric on the item page and on a task's side panel in a run's graph.
- Since 0.2.3: an Item filter, and the Execution chains page became Dependencies: the whole estate on one graph.
- The products are now called Data Catalog, Job Monitor and Report Audience.
- Lineage follows schema-level shortcuts to their source tables, and
runMultipleDAGs andnotebook.runarguments into child notebooks (from 0.1.1).
Same rules as before
- It runs in your tenant. The scanner, the database and the app all live in a workspace you own. There's no FabriBuddy server, account or telemetry. How this works.
- Read-only. It reads run history, schedules and metadata. It never starts, stops or changes a run, and it never reads the rows in your tables.
- Free and MIT licensed. The code is on GitHub.
Already on FabriBuddy? Update by importing the new deploy notebook and running it. New? Deploy it in about 15 minutes.