Docs · Updated November 2026
Job Monitor
What runs in your tenant, what each run started, and how long every step took: pipelines, notebooks, Dataflows Gen2, semantic model refreshes, Spark job definitions and copy jobs.
The Fabric Monitor hub lists runs one item at a time. The Job Monitor follows a run down its
chain. A run of pl_master opens to the child pipeline it invoked, that pipeline's dataflow and
notebooks, and the notebooks an orchestrator notebook ran with runMultiple, notebook.run or
%run. Each step shows how long it took against how long it usually takes.
Every item and its last runs, then one pipeline: its details and its execution chain. Then every item's runs over the last 6 hours, the month, and the whole estate's dependencies.
Daily or live
By default the monitor is as fresh as the last daily scan. Turn on
live (LIVE_MONITOR = True when you deploy) and new runs show up within about a minute
and a half: FabriBuddy_Live reads Fabric every 60 seconds, and the app checks for changes
every 30 seconds.
Pages
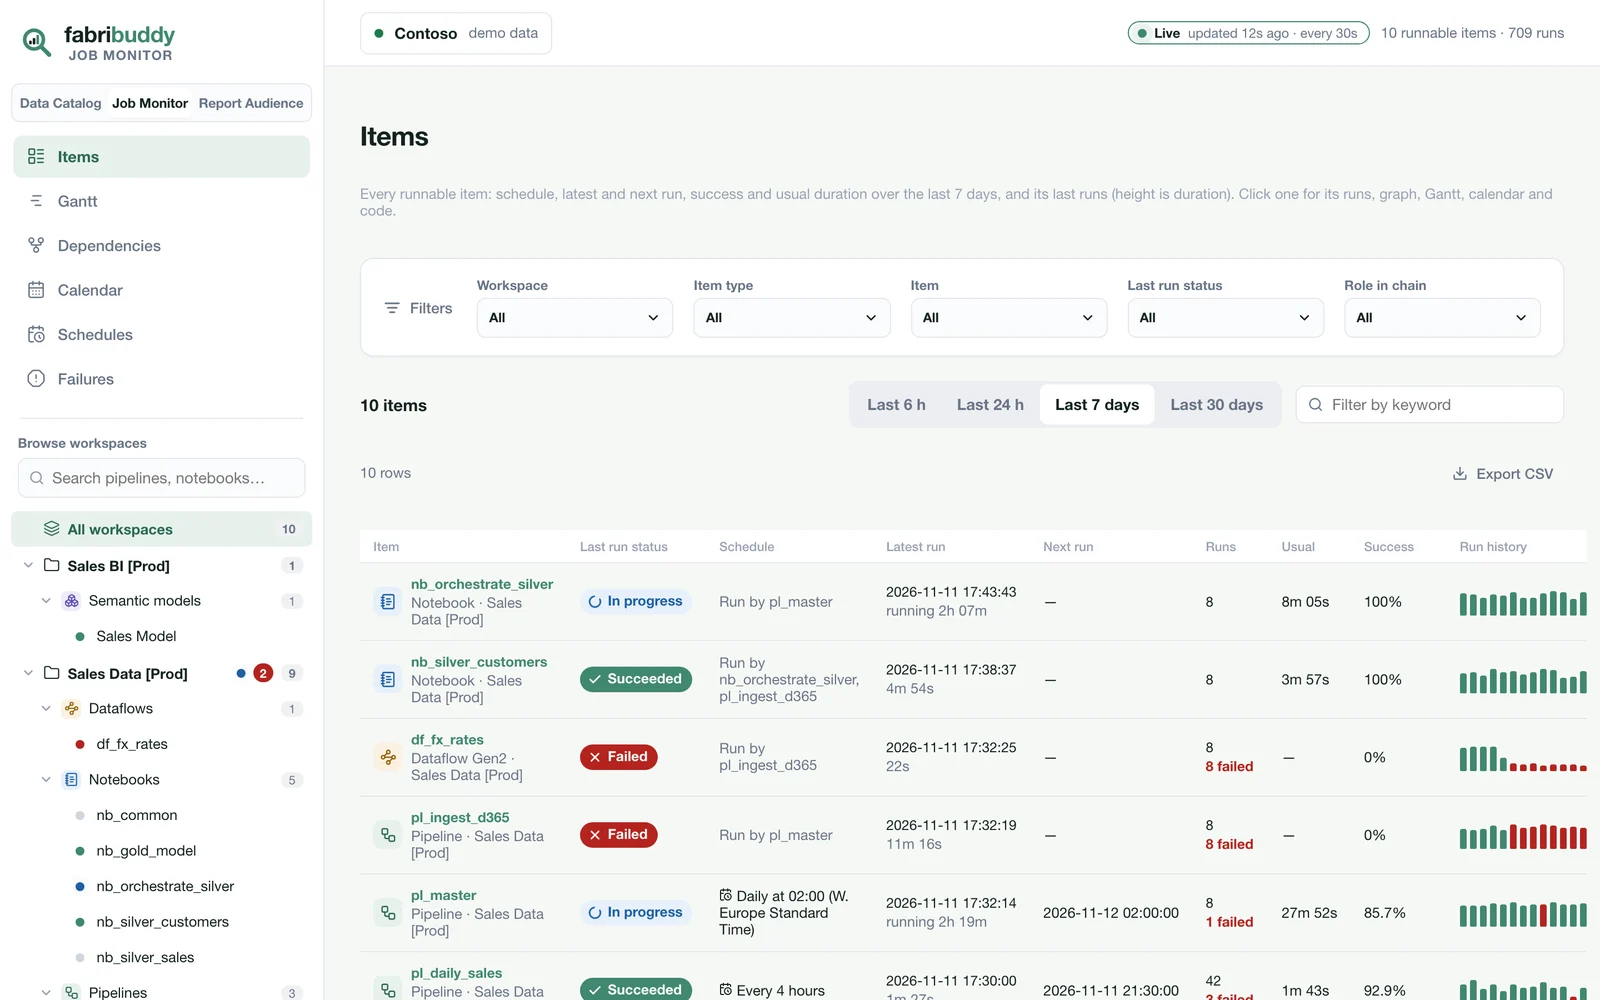
Every page except Dependencies has the same filters: workspace, item type, item, status, role in a chain and a keyword. Items, Gantt and Failures also have a time range (last 6 hours, 24 hours, 7 days or 30 days), and Schedules has the same choices looking ahead. Your picks follow you from page to page.
| Page | What it answers |
|---|---|
| Items | Every runnable item in one list: its schedule (or what runs it), the status and time of its latest run, its next run, its runs and failures in the range, its usual duration and success rate, and its run history as bars (height is duration, colour is status). |
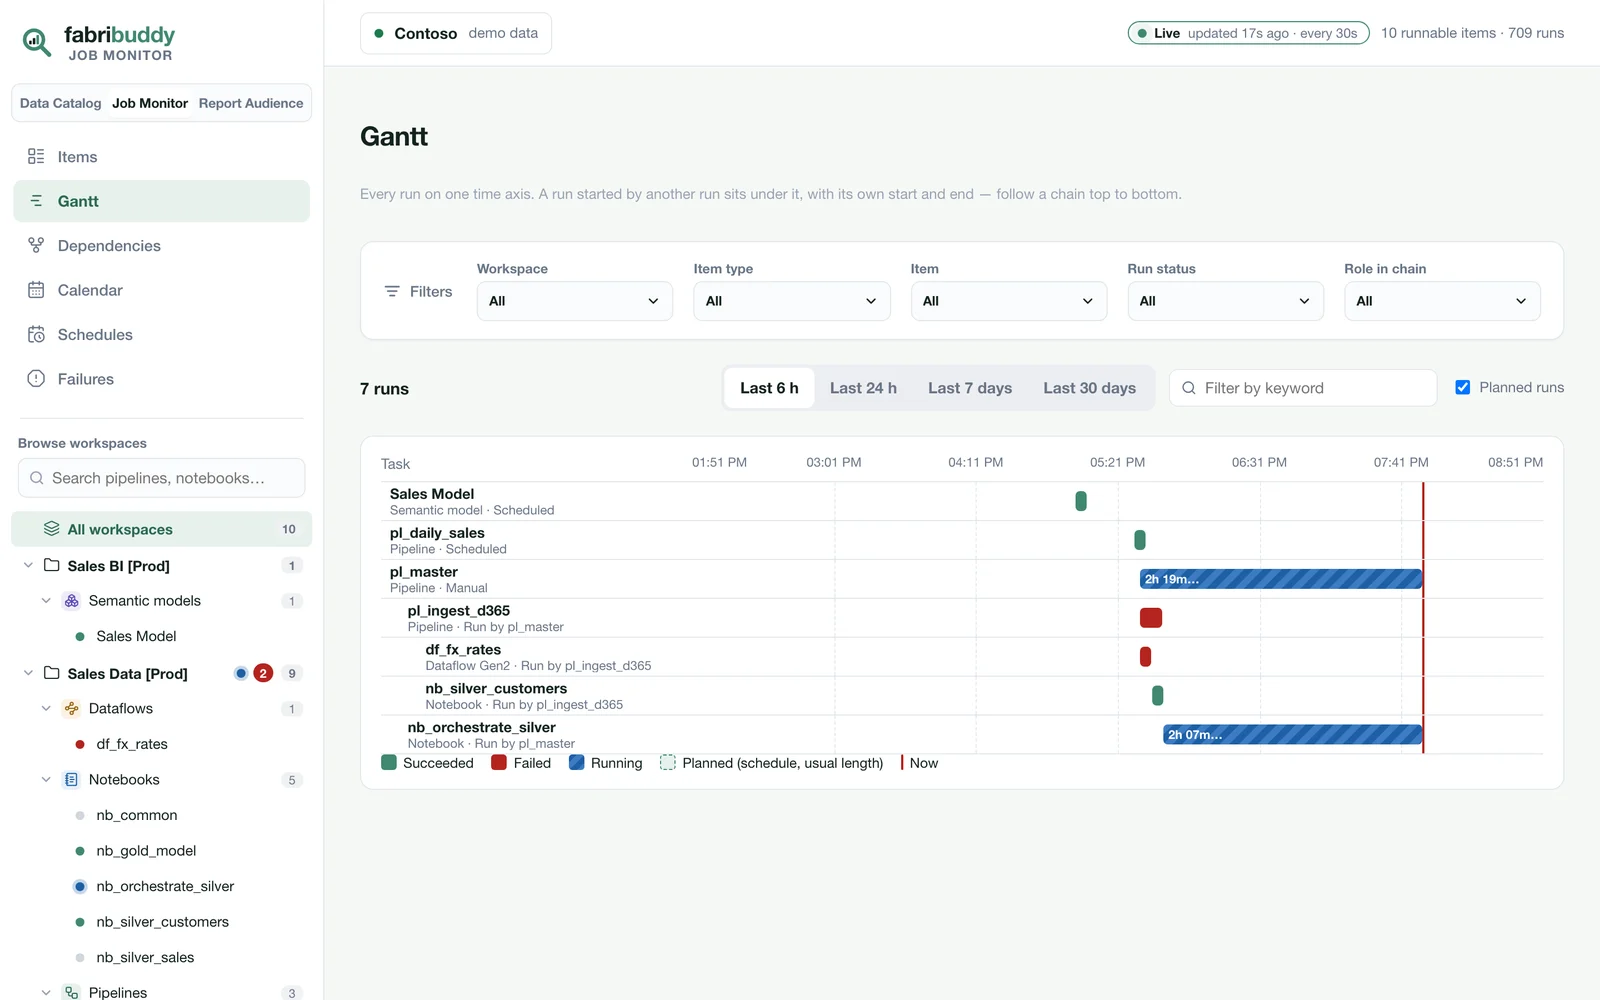
| Gantt | Runs on a time axis. Over 6 or 24 hours each run is a row, and a run started by another sits under it. Over 7 or 30 days each item is one lane with all its runs on it, so drift and failed nights stand out. Planned runs show as outlines. |
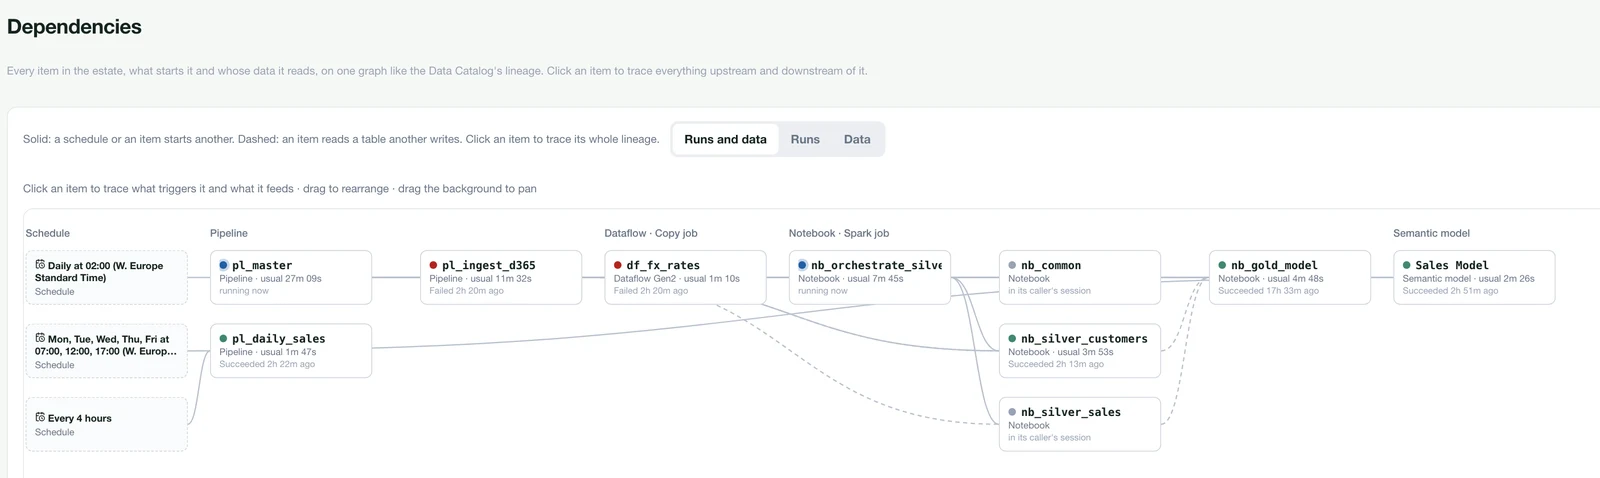
| Dependencies | The whole estate on one graph, like the Data Catalog's lineage: every item, what starts it (a schedule, a pipeline, an orchestrator notebook) and whose data it reads. Solid lines: one starts the other. Dashed: one reads a table the other writes. Switch between Runs and data, Runs and Data, and click an item to trace everything upstream and downstream of it. Below the graph are a table of every item's dependencies and the dependency checks. |
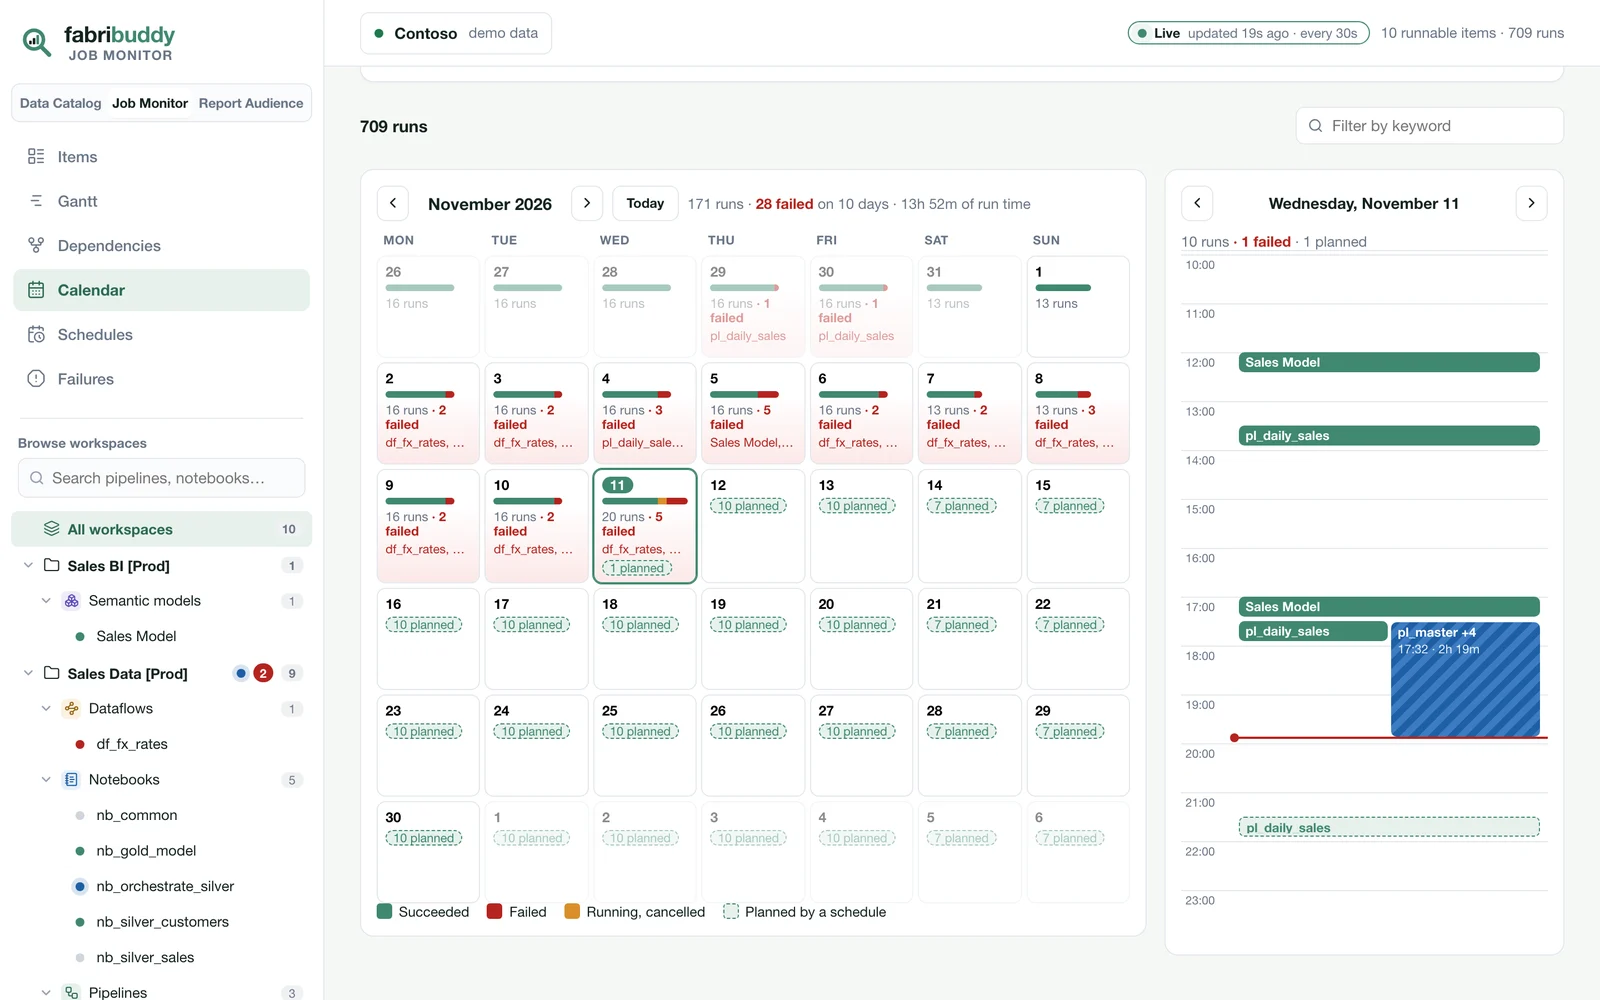
| Calendar | A month of runs: each day's outcome, its failed items and what the schedules will start. Next to it, the picked day hour by hour, with each run (or chain) as a block. |
| Schedules | Every schedule, its next runs over the next 6 hours to 30 days, each item's last 5 runs, and items started twice. |
| Failures | Failed runs grouped by item and error, so ten nights of the same failure is one row marked 10×. |
An item
Open an item to see its schedule, latest run, next run, last five runs (duration and status) and what runs it at the top, and Open in Fabric to go to the item in the Fabric portal. Below that are its tabs:
- Overview: the item's details (type, workspace, ID, what starts it, its last error, the tables it reads and writes, its usual duration) and its last runs.
- Runs: every run, with how long it took against the usual time.
- Graph: one run's tasks, with details for each in a side panel.
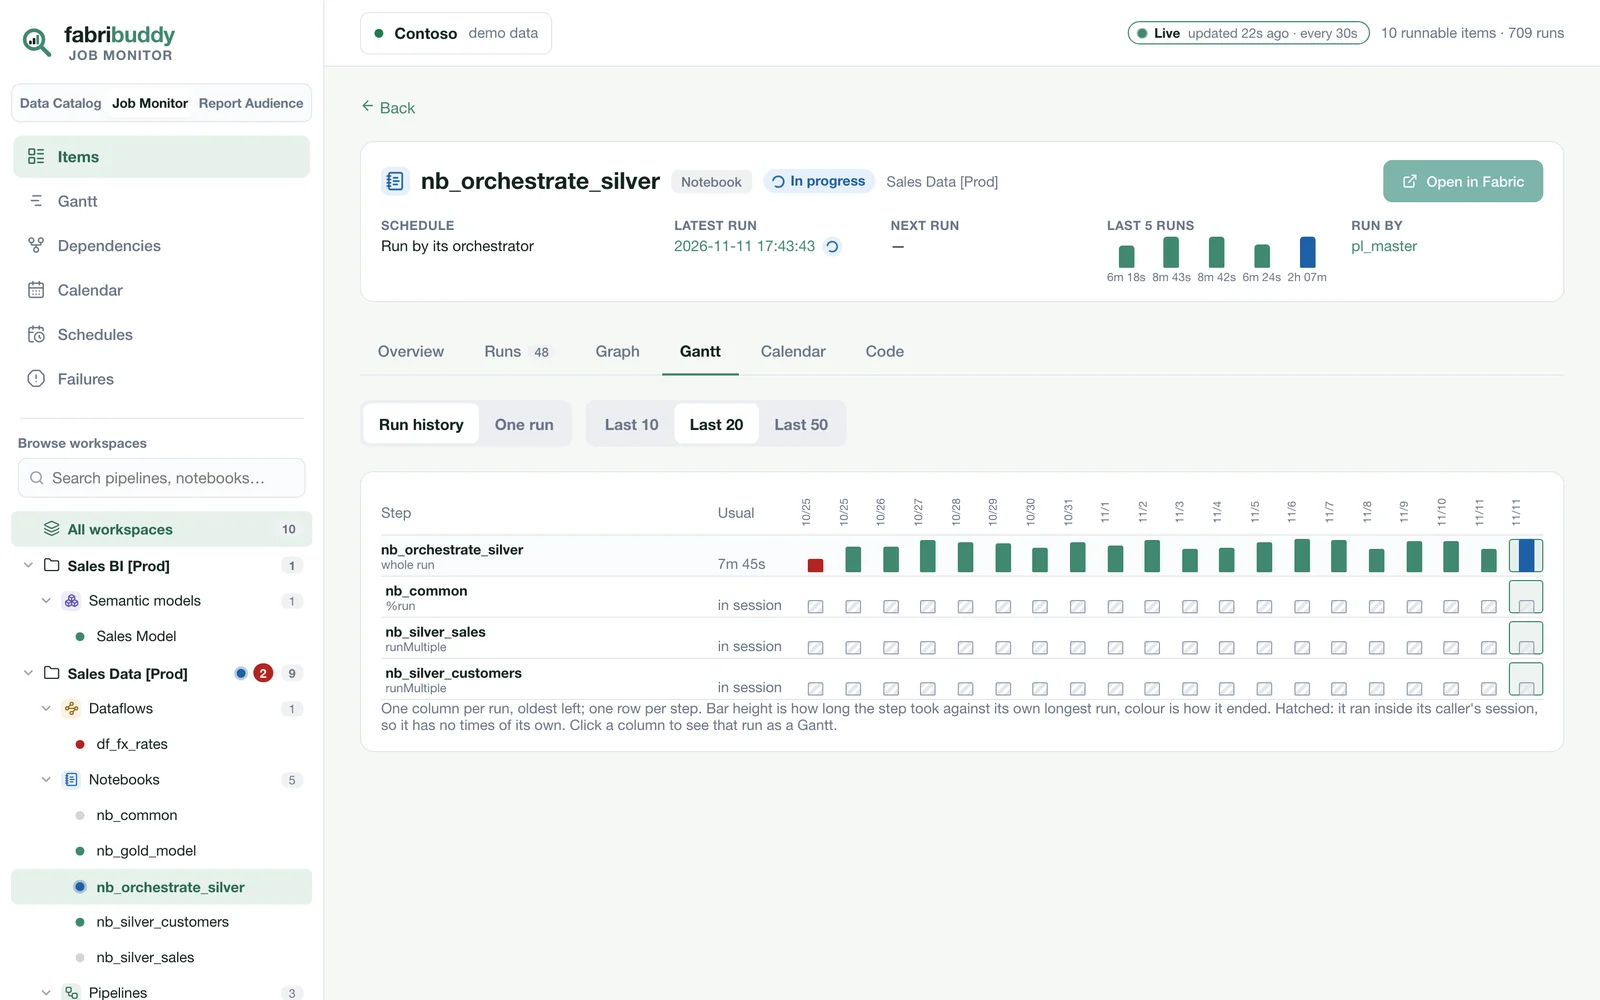
- Gantt: the run history as one column per run and one row per step, so you can see which step got slower or started failing. Switch to One run for a single run's timeline.
- Calendar: the item's month (each day's runs and failures), a day hour by hour, and its busy hours: run time per weekday and hour, to see when it crowds the capacity.
- Code.
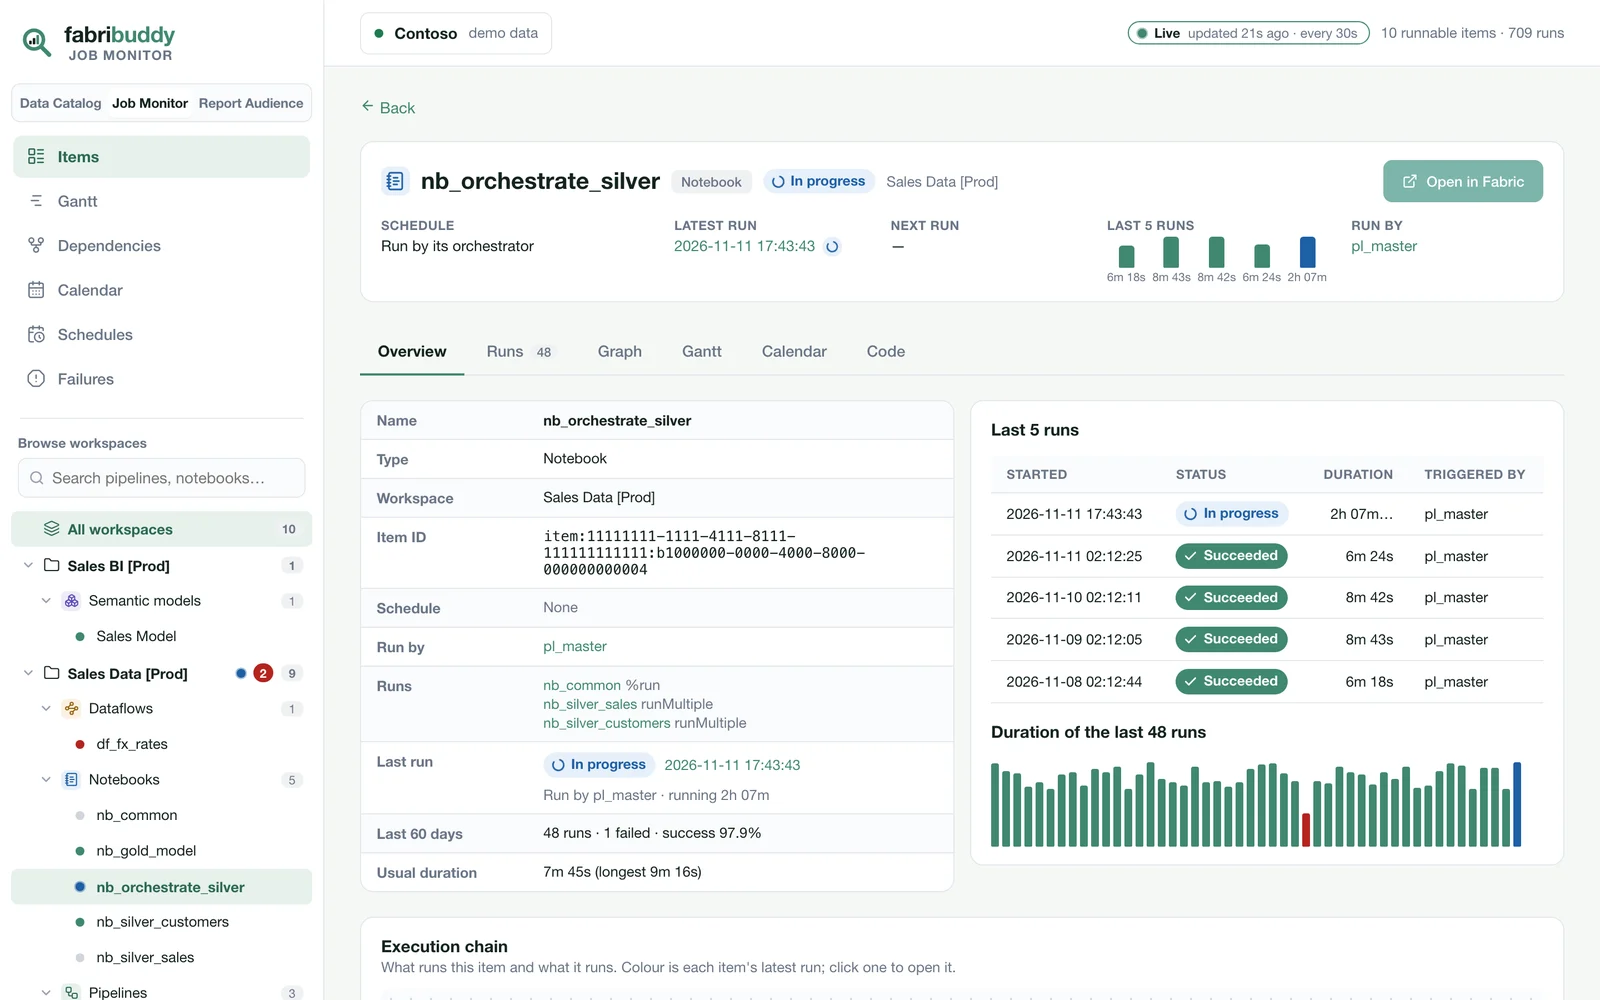
Open in Fabric is also on a task's side panel in a run's graph, for the item that task ran. On the demo the button is greyed out, because the demo's items don't exist in Fabric.
The sidebar lists workspaces and their items by type. Click a workspace to filter every page to it. Click an item to open it. The dots show each item's latest run, and a pulse means it's running now.
Dependency checks
The Dependencies page checks every data dependency, meaning an item that reads a table another item writes:
- Ran on failed input: the reader ran after the writer's latest run failed, so it read stale or partial data.
- Started before its input was ready: the reader started while the writer was still running.
- Not ordered: no pipeline or orchestrator notebook runs the two in order. They start on their own schedules and only line up by luck.
- Started twice: an item has its own schedule and is also run by an orchestrator.
Each finding links to an example run and says how to fix it.
How chains are found
- Pipelines: the activities Fabric reports for each run (
queryactivityruns), with their own start, end, status and error. A child pipeline, notebook, dataflow or model refresh that an activity started is linked to its own run. - Notebooks:
notebook.run,runMultiple(including its DAG) and%run, parsed from the code, as on the Data Catalog.
Notebooks run inside another notebook have no times of their own
runMultiple, notebook.run and %run run the child inside the caller's Spark session. Fabric
records one run for the caller and none for the child. These children show as in session
across the caller's span, never with invented times.
Live
By default the monitor shows what the last scan read, and the badge at the top says Last scan.
To see runs as they happen, run FabriBuddy_Live. Every minute it reads what's running, what
those runs will start next, and anything a schedule is about to start, plus a rotating slice of
everything else. It then rewrites only the monitor's pages in FabriBuddy_DB. The app checks
every 30 seconds, so a new run or a finished step shows within about a minute and a half. The badge
then says Live. If the notebook stops, it says Live paused.
- Turn it on: run
Deploy_FabriBuddywithLIVE_MONITOR = True. It schedules FabriBuddy_Live hourly, and each run stays live for 55 minutes. Or schedule the notebook yourself. - Turn it off: turn off or delete the schedule in FabriBuddy_Live → Schedule.
- Settings:
minutes(55) andevery_seconds(60) in the notebook. Everything else comes from Load_FabriBuddy_E2E. Started before the first scan has finished, it waits for it. All the details. - Cost: a small Python notebook session for as long as it runs, so all day when it's scheduled hourly. Without it, the monitor is as fresh as the last scan.
- Read-only, like the scan: the same service principal and GET-only calls (plus the read-only
queryactivityruns). It never saves the scanner's state. The daily scan stays the only writer of that state, and it re-reads everything anyway.
What's needed
Run history is read from workspaces where the service principal is a Contributor or higher. That's the same access Fabric needs to list job instances. Schedules come from the Job Scheduler, and a semantic model's refreshes and refresh schedule come from Power BI.